STORM SCIENCE: Using Forecast Hodographs to Predict Likelihood of Tornadoes
Dr. Reed Timmer, Lead Meteorologist March 29, 2016
According to the Glossary of the American Meteorological Society (AMS), the hodograph is defined mathematically as the locus of one end of a variable vector as the other end remains fixed. In meteorological terms, a hodograph represents the vertical distribution of the horizontal wind (AMS, 2016). Very generally, meteorologists, forecasters, and storm chasers use hodographs to assess the magnitude of vertical wind shear in the atmosphere, and most importantly, the likelihood of tornadoes based on the forecast alignment of the low-level wind shear vectors relative to the storm motion. I’ve included below a hodograph I plotted for the Topeka, KS area tomorrow (Wednesday) evening ahead of the dry line based on the latest NAM model. Most storm chasers assume that large, curved hodographs are favorable for tornadoes, but the use of hodographs to predict supercells and especially tornadoes is much more complicated than that. An understanding of the underlying physical processes represented by the hodograph is also vital to use them effectively. Here, I’ll try to explain some of the basics and discuss in terms of tornado potential for Wednesday’s severe weather setup.
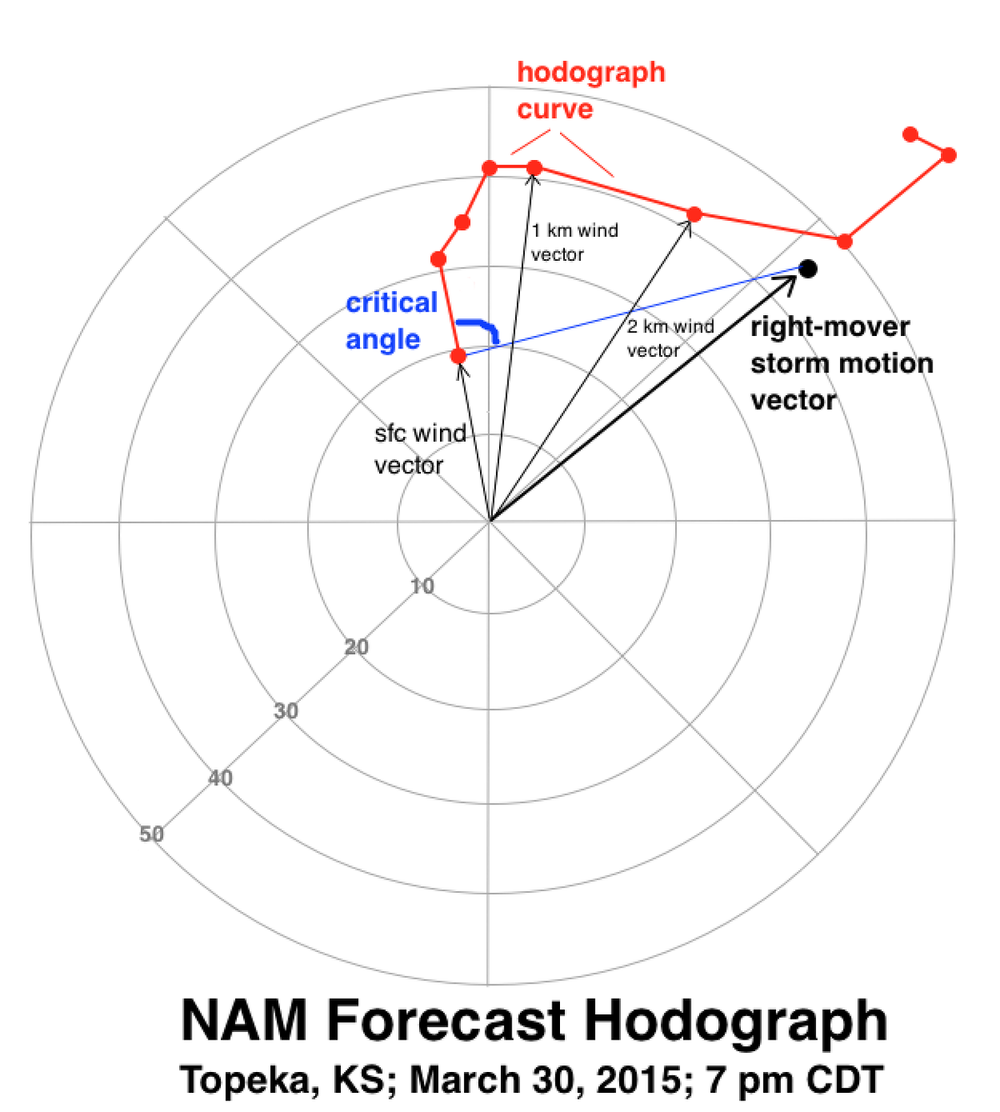
The hodograph above was plotted as the curve which connects the wind vectors (wind speed and direction) from the surface and up at different levels of the atmosphere, in terms of radial coordinates. You’ll see above that the surface wind vector at Topeka at 7 pm CDT is forecast to be from the SSE at just under 20 knots ahead of the dry line, with a greater than 40 knot wind from the SSW (near due S) at just 1 km above the ground. The wind continues to increase in speed and shift more to a southwesterly direction with height, all contributing to a SW to NE storm motion for the right-moving supercell at a quick 45 knots (indicated by the black vector and circle, above). In general, the magnitude of the area generated between the hodograph curve and the storm motion vector is proportional to the storm-relative helicity between the included later in the atmosphere. If winds are unidirectional with height between a deep layer in the atmosphere, the result is a straight-line hodograph that is also parallel to the storm motion vector, and near zero storm-relative helicity. This type of profile is generally not conducive for mesocyclonic tornadoes, and is more supportive of non-tornadic, splitting supercells with both left and right movers favored; assuming deep-layer wind shear is supportive of mesocyclones. As you can see above in the forecast hodograph from northeast Kansas tomorrow evening, this curve is far from a straight-line and shows low-level wind shear generally supportive of tornadoes, even a strong tornado or two if the thermodynamic ingredients are also in place.
Another characteristic of the low-level hodograph that has been shown to be important for tornadoes, and especially the occurrence of strong tornadoes, is the “critical angle”, which is the angle between the storm motion vector and the 500 m shear vector; the latter being the difference between the 500m and surface wind vectors (Esterheld and Giuliano, 2008). Esterheld and Giuliano (2008) showed in their research that a majority of the strong tornado cases in the U.S. that they examined showed a critical angle of near 90 degrees. I identified the critical angle in the hodograph I produced above, but accidentally for the 250m shear vector, with either method showing a critical angle of near or slightly less than 90 degrees for this forecast hodograph in northeast KS tomorrow evening. The strength of the shear vector between the lowest 500m or at least 1 km is also important, with this hodograph showing a 0 to 1 km shear vector (difference between the surface and 1 km wind vector identified above) of near or slightly over 20 knots, which is sufficient for tornadoes especially with a near 90 degree critical angle. Generally, the stronger this low-level shear vector, the greater the likelihood of strong tornadoes given a favorable critical angle. I remember seeing low-level shear vectors more than double the magnitude of this forecast hodograph in the models preceding the April 27, 2011 “Super Outbreak” in Dixie Alley, and covering a multiple state region across the south-central and southeast U.S. We all know what happened on that day.
I’ve included a figure below from Esterheld and Giuliano (2008), who were my officemates in graduate school at OU at the time, which shows the relative importance of the near 90 degree critical angle in the representative hodographs of the significant tornado cases examined.
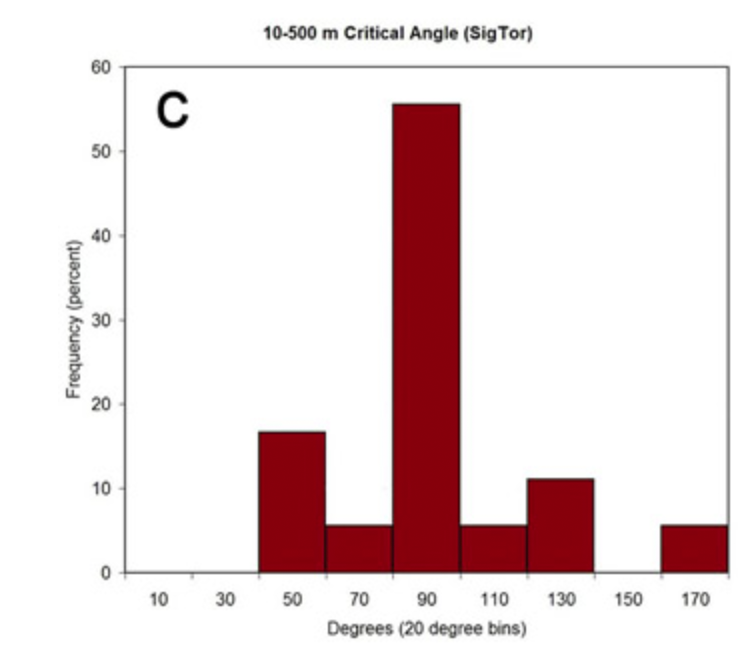
Esterheld and Giuliano, 2008; E-Journal of Severe Storms Meteorology, Vol. 3, No. 2
In order to understand why the critical angle of 90 degrees between the surface and 500m might be important for tornadoes, consider two pieces of paper moving at different speeds equal to the wind speed near the surface and at a level just above the ground, respectively. The shear between these two theoretical planes would generate invisible rotating columns of air between them that are perpendicular to the angle of the planes and parallel with the ground. These are also called vortex lines, and when a storm is moving parallel to them in the atmosphere they can be more effectively titled into the vertical by the associated updrafts and downdrafts. The component of vorticity oriented parallel to the storm motion is termed streamwise vorticity, which is a term I am sure you have read in forecast discussions of severe weather. Accordingly, a critical angle of 90 degrees on a hodograph between the surface and 500m means that a surface-based storm would theoretically ingest purely streamwise vorticity within that layer that is very close to the ground, which is shown to be important for the discrimination between strong tornado and non-tornado events by Esterheld and Giuliano (2008). Now it is easy to understand why a greater area between the hodograph curve and storm motion vector represents greater storm relative helicity.
It is important to realize, however, that even if the hodograph for an atmospheric profile is perfect for tornadogenesis, it’s impossible for a tornado occur without a surface-based, ideally discrete supercell that can work with those kinematics. So, other atmospheric factors such as the magnitude of instability or presence of a convection-limiting capping inversion, and the positioning of fronts or outflow boundaries that could contribute to storm initiation; amongst a multitude of others, must be considered to even come close to accurately predicting tornadoes. For tomorrow (Wednesday) afternoon/overnight, eastern Kansas is not the only area with forecast hodographs showing tornado potential. The forecast thermodynamics and wind fields anywhere in the warm sector east of the dry line from Northwest Texas to the surface low forecast to be near the southeast NE/southwest IA border tomorrow evening are at least marginally supportive of tornadoes, but it appears the greatest storm coverage/likelihood for discrete supercells collocated with the forecast hodographs most conducive for tornadoes appears to be centered over eastern KS, extreme southeast NE/northwest MO/southwest IA, possibly extending into OK/NW TX but with much more isolated storm coverage. Overnight and Thursday, the severe weather and tornado threat will gradually shift toward the south-central U.S.
WarningAware provides a highly customizable service to monitor weather and emergency alerts for businesses and organizations.
Our service can monitor your locations for alerts and send intelligent notifications to both internal and external contacts.
Learn More